ASME
The tropical Pacific Ocean’s surface temperature (SST) anomalies remained within the neutral range in July 2018 over the Nino3.4 region (Figure A). Likewise, most of the atmospheric indicators of El Niño/La Niña indicated neutral conditions. While the 1-month Nino3.4 value for July 2018 was -0.2, slightly lower than that of the previous month, the 3-month (May to July 2018) average Nino3.4 remained close to zero (Figure B).
Models indicate that the tropical Pacific Ocean SST anomalies will become warmer (Figure C) but the chances of El Niño developing is not much more than for neutral conditions for the August-October season in progress (Figure D). Models indicate a higher probability/chance of a late, weak to possibly moderate El Niño developing from the September-November 2018 season onwards. If the El Niño were to develop, its impact is not expected to be significant given it is not likely to be strong and its likely late development.
Impact of El Niño/La Niña on Southeast Asia
Typically the impact of El Niño on Southeast Asia is drier-than-normal rainfall conditions, especially during the period June and October (Figure E), especially over the Maritime Continent. Warmer temperature conditions typically follow drier periods. The impact is more significantly felt during strong or moderate intensity events. During La Niña events the opposite, i.e. wetter-than-normal conditions, normally occurs. For November – January season, the impact of El Niño/La Niña is less coherent for some parts of the region, including mainland Southeast Asia, Borneo, southern Sumatra, and the Malay Peninsula (Figure F). Locally-specific impact differs from place to place and for different seasons.
No two El Niño events or two La Niña events are alike in terms of their impact on the region’s rainfall and temperature. Furthermore, the strength of events and the corresponding impact do not always scale. For example, there were years where relatively weaker El Niño/La Niña events had more impact on rainfall during the June to October period than the stronger events, but this could be contributed by other factors as well.
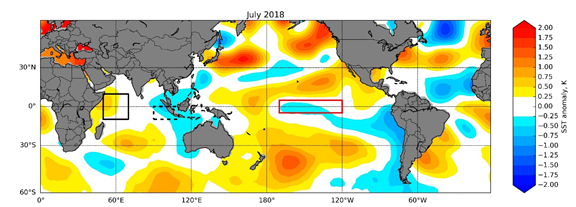
- Figure A: Sea-surface temperature (SST) anomalies for July 2018 with respect to 1981-2010 climatology. Warm shades show regions of relative warming, while cool shades show regions of relative cooling. The tropical Pacific Ocean Nino3.4 region (solid red box, 120°W-170°W and 5°S-5°N) experienced a slight return of cold anomalies which resulted in the Nino3.4 value dipping in July 2018. The western Indian Ocean, WTIO (solid black box, 50°E-70°E and 10°S-10°N) was slightly warmer compared to the south-eastern Indian Ocean, SETIO (dotted black box, 90°E-110°E and 10°S-0°N). The Indian Ocean Dipole Mode index (WTIO minus SETIO) although positive, was still bordering on neutral values. Data source: ERSSTv4 from NOAA.
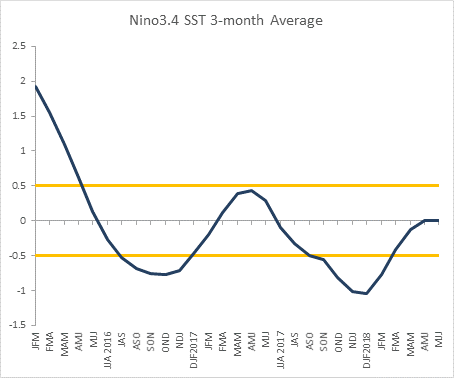
- Figure B: The Nino3.4 index using the three-month running means of SST anomalies (against 1981-2010 base period) in the Nino3.4 region bounded by 5°N to 5°S and 170°W to 120°W. Warm anomalies (≥ +0.5) correspond to El Niño conditions while cold anomalies (≤ -0.5) correspond to La Niña conditions; otherwise neutral (> -0.5 and < +0.5). The horizontal axis is labelled with the first letters of the 3-month seasons, e.g. JFM refers to January, February, and March seasonal average. Data source: ERSSTv4 from NOAA.
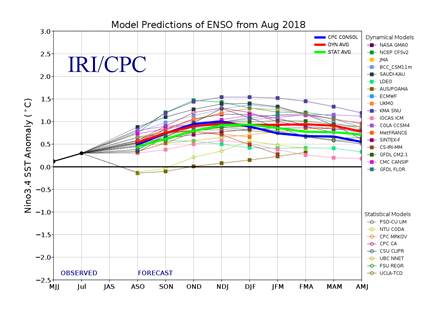
- Figure C: Forecasts of Nino3.4 index’s strength for the second half of 2018 and first half of 2019 from various seasonal prediction models of international climate centres. Values above +0.5°C indicate El Niño conditions, below -0.5°C indicate La Niña conditions, and in between indicate neutral conditions, i.e. neither El Niño nor La Niña. Models predict the Nino3.4 index to cross the neutral value from the September-November season onwards, with a possibility of a late and weak El Niño developing (image credit: IRI-CPC).
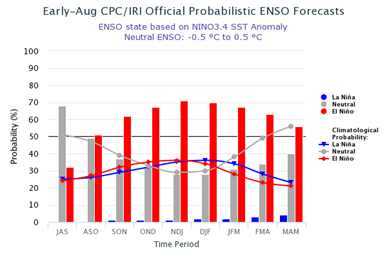
- Figure D: Probability of El Niño (red), La Niña (blue) and neutral conditions (grey) for the second half 2018 and early 2019. Models favour El Niño conditions over neutral and La Niña from the September-November 2018 season onwards (image credit: IRI-CPC).
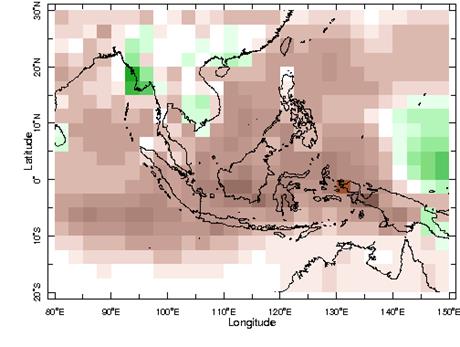
- Figure E: June to October rainfall anomaly composite for El Niño years minus La Niña years. Brown shades show regions where El Niño induce drier conditions and La Niña induce wetter conditions, while regions in green shades show the opposite effect, i.e. El Niño inducing wetter conditions and La Niña inducing drier conditions (image credit: IRI Data Library). Note that this anomaly composite was generated using a limited number of El Niño/La Niña occurrences between 1979 and 2016 and therefore should be interpreted with caution (data: NOAA CPC CAMS_OPI).
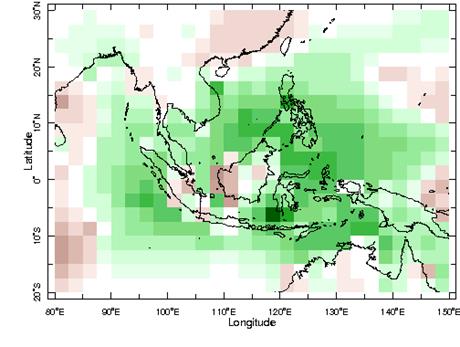
- Figure F: November to January rainfall anomaly composite for La Niña years minus El Niño years. Green shades show regions where La Niña induce wetter conditions and El Niño induce drier conditions, while regions in brown shades show the opposite effect, i.e. La Niña inducing drier conditions and El Niño inducing wetter conditions (image credit: IRI Data Library). In general, La Niña events tend to induce wetter conditions for many parts of the region, except for Borneo and Southern Sumatra. Note that this anomaly composite has been generated using a limited number of El Niño/La Niña occurrences between 1979 and 2016 and therefore should be interpreted with caution.
Categories: Fire & Haze