By: Bob Henson and Jeff Masters , 6:00 PM GMT on March 24, 2017
The world’s costliest flood disaster of 2017 is still unfolding across parts of coastal Peru, where extreme rainfall atop normally dry terrain has led to episodes of major flooding over the last few weeks. More than 110,000 people have been displaced by flooding since December, according to Reuters, and more than 80 deaths have been reported.
The death toll makes the floods of 2017 Peru’s deadliest floods since 2009 – 2010, when 158 people died in flooding between December and March. Preliminary damages from the 2017 rains and flooding in Peru are estimated at $1.4 billion (0.7% of Peru’s GDP), according to insurance broker Aon Benfield. Significant damage has been done to Peru’s infrastructure, with 2,188 kilometers (1,360 miles) of main roads and 928 kilometers (577 miles) of rural roads destroyed, along with 194 bridges. Approximately 671 kilometers (417 miles) of irrigation canals have been destroyed and as many as 23,000 hectares (56,000 acres) of crops damaged or destroyed, including grapes, mangoes, and bananas.
![]()
Figure 1. Huachipa district, east of Lima, on March 19, 2017. Flash floods and landslides hit parts of Lima, where most of the water distribution systems have collapsed and people are facing drinking water shortages. Photo credit: ERNESTO BENAVIDES/AFP/Getty Images
According to EM-DAT, the international disaster database, the most expensive natural disaster in Peruvian history occurred during the El Niño rains of 1983, when heavy rains unleashed a landslide that killed 596 people and cost $2.4 billion (2017 dollars.) The Global Facility for Disaster Reduction and Recovery (GFDRR) estimated total damages from the rains and flooding of the 1982 – 1983 El Niño amounted to 8.1% of Peru’s GDP. The El Niño rains of 1997 -1998 also exacted a heavy toll; the GFDRR estimated that Peru suffered nearly $2 billion in losses (5.9% of GDP).
Flooding where it’s been raining—and where it hasn’t
The current Southern Hemisphere summer is Peru’s rainy season, but this year has delivered in a much bigger way than usual. At least two stations in the far northern coastal province of Piura recorded about 10 times their average rainfall for the period from January through March, according to a climate.gov blog post by NOAA’s Tom Di Liberto. At a desert location like this, it’s to be expected that the wettest years will produce several times the seasonal average. Still, according to Di Liberto, “2017 is already likely one of the wettest years on record for San Miguel in the Piura province.” San Miguel de Piura had racked up 10” by early March, compared to a typical wet-season total of just 2”. On March 3, the town of Partidor reported an all-time daily record of 258.5 mm (10.18”),
While the heaviest rains have deluged the Pacific-facing west side of Peru’s coastal mountains, especially toward the north, the resulting floods and mudslides have affected many areas downstream, between the mountains and coast. This includes Peru’s capital, Lima, where major damage and disruption (including a disabled municipal water system) have occurred despite virtually no rain in the lowest-lying parts of the city. Just 0.7 mm or 0.03” fell at Lima’s airport from Feb. 2 to Mar. 23. Lima is a premier example of a coastal desert city, with a climate dominated by gentle onshore flow atop cool, upwelled Pacific water. The result is a paradoxical blend of high humidity, frequent cloud cover and fog (especially in winter), but very little rain. Lima’s annual average precipitation is a mere 0.6”, and the city’s wettest day on record—January 16, 1970—brought just 17 mm (0.67”).
![]()
Figure 2. Sea-surface temperatures have been warmer than average over the past month across most of the southeastern Pacific. The unusual warmth has been especially sharp near the coast of Peru, where the monthly departures from average are greater than 3°C (5.4°F). Image credit: NOAA/NWS Climate Prediction Center.
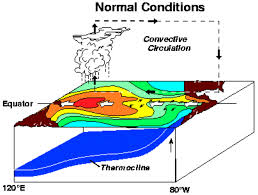
El Niño’s weird evolution and its impact on Peru
Peru normally gets its heaviest rains during El Niño events. When El Niño is strong, unusually warm waters extend through the eastern tropical Pacific all the way to the coast of South America. The process shuts off the cold, upwelled current that normally keeps coastal Peru air-conditioned and mostly rain-free. The warmer water is typically accompanied by a stronger tendency toward moist, warm westerly winds off the Pacific into Peru. When that flow reaches the mountains, heavy rains are often squeezed out.
This chain of events played out during the super El Niño of 1997-98, when flooding and mudslides took more than 200 lives in Peru and displaced hundreds of thousands in early 1998. The floods of 2017 have been deemed the worst for Peru since 1998. Some locations in the Piura province have received even more seasonal rain and more extreme one-day rainfalls this year than they did in 1998.
What’s puzzling this time is that the 2014-16 El Niño, the strongest since 1997-98, officially ended more than half a year ago, and it didn’t bring exceptional rain to Peru. Weak La Niña conditions then took hold in late 2016, only to quickly dissipate in early 2017. Meanwhile, sea-surface temperatures off Peru—where the concept of El Niño originated—have skyrocketed since the first of the year. The Niño1+2 region has been running more than 2.0°C above average since late February (see Figure 2 above). This warming has been so strong, and the rainy pattern so clear, that Peru’s national agency for El Niño research, ENFEN, issued a coastal El Niño alert that’s been in place since February 15. Meanwhile, the broader-scale Pacific pattern still hasn’t meshed with the standard El Niño criteria used by NOAA and other international agencies.
Why didn’t El Niño bring the expected heavy rains to Peru in early 2016, and what’s going on this year? The answer may lie in El Niño’s geographic flavor, according to Ken Takahashi (@ktakahashig), an expert at ENFEN and the Instituto Geofísico del Perú. Takahashi has analyzed a number of El Niño events by whether the focus of warming is in the central equatorial Pacific (C-type) or eastern equatorial Pacific (E-type). The other two “super” events of recent decades, 1982-83 and 1997-98, were both E-type, but the 2014-16 event, which peaked in 2015-16, ended up as more of a hybrid, leaning toward a C-type (see Figure 3 below).
![]()
Figure 3. Each El Niño can be rated according to whether its sea-surface warming is more focused in the central equatorial Pacific (C index) or the eastern equatorial Pacific (E index). Of the three strongest El Niño events since 1950, the 1982-83 and 1997-98 events were dominated by eastern Pacific warming (E-type), whereas the 2015-16 warming was more of a C-type than E-type event.
“For Peru, the pattern mattered for the impacts,” said Takahashi in an email. In 2015-16, he noted, “the drying effect of the central Pacific warming dominated over the rainy effect of the coastal warming. That was quite different from what’s going on this year, in which the large-scale atmospheric pattern is still La Niña-ish, which helps the rains associated with the coastal El Niño.” Takahashi sees some parallels between the current event and another “coastal” El Niño in 1925, which he analyzes in a paper now in review.
Will we get a full-blown El Niño this year?
“The current state of the Pacific is a wonderful example of why we need to change the current definition of the El Niño-Southern Oscillation,” said Michael Ventrice (The Weather Company). “We often try to bin all El Niños or La Niñas into the same category, where in reality there is a spectrum. This year nicely illustrates this, as the current configuration of sea-surface temperature anomalies does not nicely fit the current definition of ENSO.”
Ventrice sees the current sea-surface temperature patterns more as a reflection of atmospheric dynamics rather than an ocean-driven process: “Since the current ocean state is likely more of a response to atmospheric wind stress, I suspect it’s unsustainable.” He’ll be watching to see if any westerly wind bursts develop over the western Pacific in April or May. If these don’t develop, then we may not get an El Niño at all in 2017, he told me. “I think a weak El Niño or neutral state is the most likely outcome at this point.” Ventrice emphasizes that we’re now in the midst of the well-known spring predictability barrier, which limits our ability to predict ENSO outcomes.
![]()
Figure 4. Departures from the seasonal norm in sea-surface temperatures (SST anomalies) since April 2016 across various parts of the equatorial Pacific Ocean. El Niño conditions are associated with SST anomalies of +0.5°C or greater in the Niño3.4 region. The Niño1+2 region has been exceptionally warm since late January even though the Niño3.4 region has been near neutral. Image credit: NOAA/NWS Climate Prediction Center.
An early appearance for the Atlantic’s first named storm of 2017?
The models are predicting the formation of a large area of low pressure a few hundred miles east of the Bahamas on Sunday and Monday, and this low has the potential to acquire characteristics of a subtropical storm as it heads north and then northeast, passing a few hundred miles southeast of Bermuda on Tuesday. Water temperatures in the region are near 24°C (75°F), which is near average, and these waters may be barely warm enough to support formation of a subtropical depression or subtropical storm. According to phase space diagrams from Florida State University, the low will initially have a warm core that will gradually weaken as the storm encounters cooler waters near 21°C (70°F) by Tuesday. We give 5-day odds of 10% of this low becoming a subtropical depression or subtropical storm. According to NOAA’s Historical Hurricane Tracks, the only March tropical cyclone ever recorded in the Atlantic was a Category 2 hurricane that passed through the Lesser Antilles on March 8, 1908.
![]()
Figure 5. GOES infrared satellite image showing an elongated frontal system extending from the northwest Atlantic into the eastern Caribbean Sea at 1645Z (12:45 pm EDT) Friday, March 24, 2017. A center of low pressure is expected to form east of the Bahamas near this decaying front. Image credit: NASA MSFC Earth Science Office.
Categories: Flood