Effectively communicating climate change is a challenge. The animated climate spiral is a different way to show the historically observed changes and resonates with a broad audience. The original version quickly went viral, being seen millions of times on facebook and twitter. A version was even used in the opening ceremony of the Rio Olympics!
This page will provide regularly updated versions of the climate spiral for several different aspects of the climate. The graphics are free to use with appropriate credit – just click the links for the full versions to download.
Current version of global temperature spiral

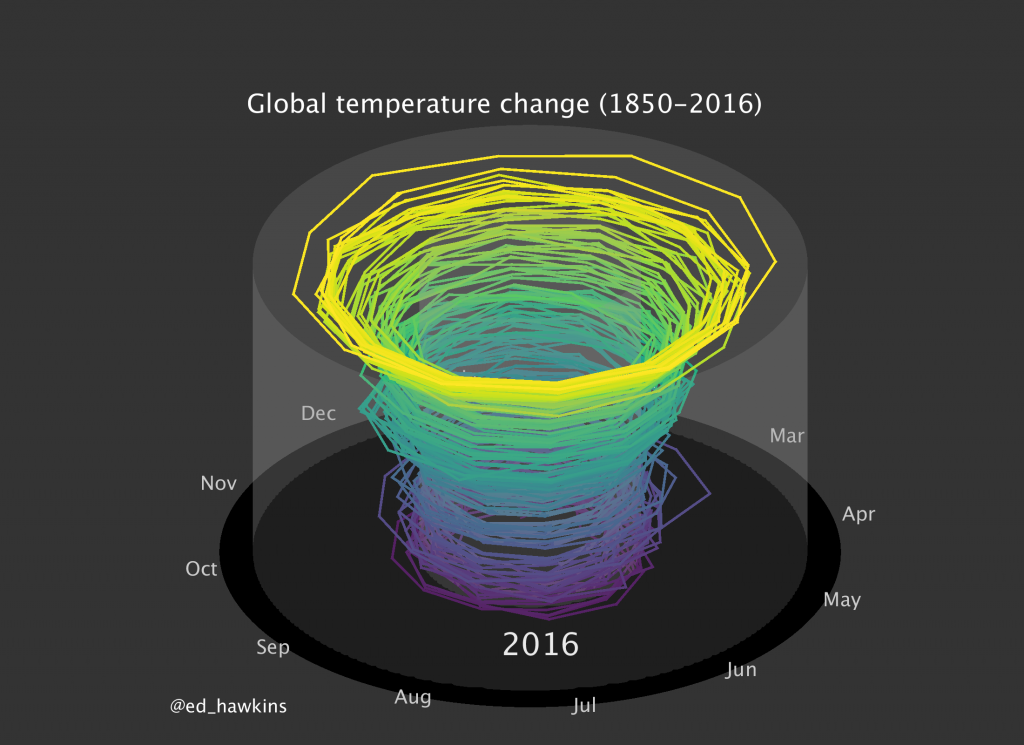
Three-dimensions
Several people suggested a 3d version of the spiral with the third dimension representing time. This visualisation is fun but harder to interpret quantitatively, and is more of an artistic representation of global temperatures.

And, there is also an animated spinning ‘tornado’ version:

Future projections of temperature
Jay Alder from the USGS has created a similar spiral visualisation for a climate model simulation for the historical period and the future, assuming high future emissions.
Arctic sea ice volume
Daily Arctic sea ice volume is estimated by the PIOMAS reconstruction from 1979-present, producing an inwards spiral as the volume of sea ice reduces. [Andy Robinson has been making a static Arctic sea ice spiral for years.]

Atmospheric carbon dioxide concentration
A recent paper by Betts et al. suggested that atmospheric concentrations of carbon dioxide would not dip below 400ppm in our lifetimes. This is the spiral of CO2 at Mauna Loa in Hawaii, showing the increase since 1958 and the small seasonal cycle:

Combined animations for temperature, CO2 and carbon budgets
Malte Meinshausen and Robert Gieseke have produced an excellent interactive tool and set of videos for exploring spirals of global temperature, carbon budgets and atmospheric carbon dioxide concentrations.
Olympics Opening Ceremony
The Rio 2016 Olympics featured climate change during the Opening Ceremony, and included a spiral representation of global temperature change.

Thanks to everyone for sharing and commenting on the original, and to Jan Fuglestvedt for suggesting the original idea
Categories: Forecasting


