March 2019
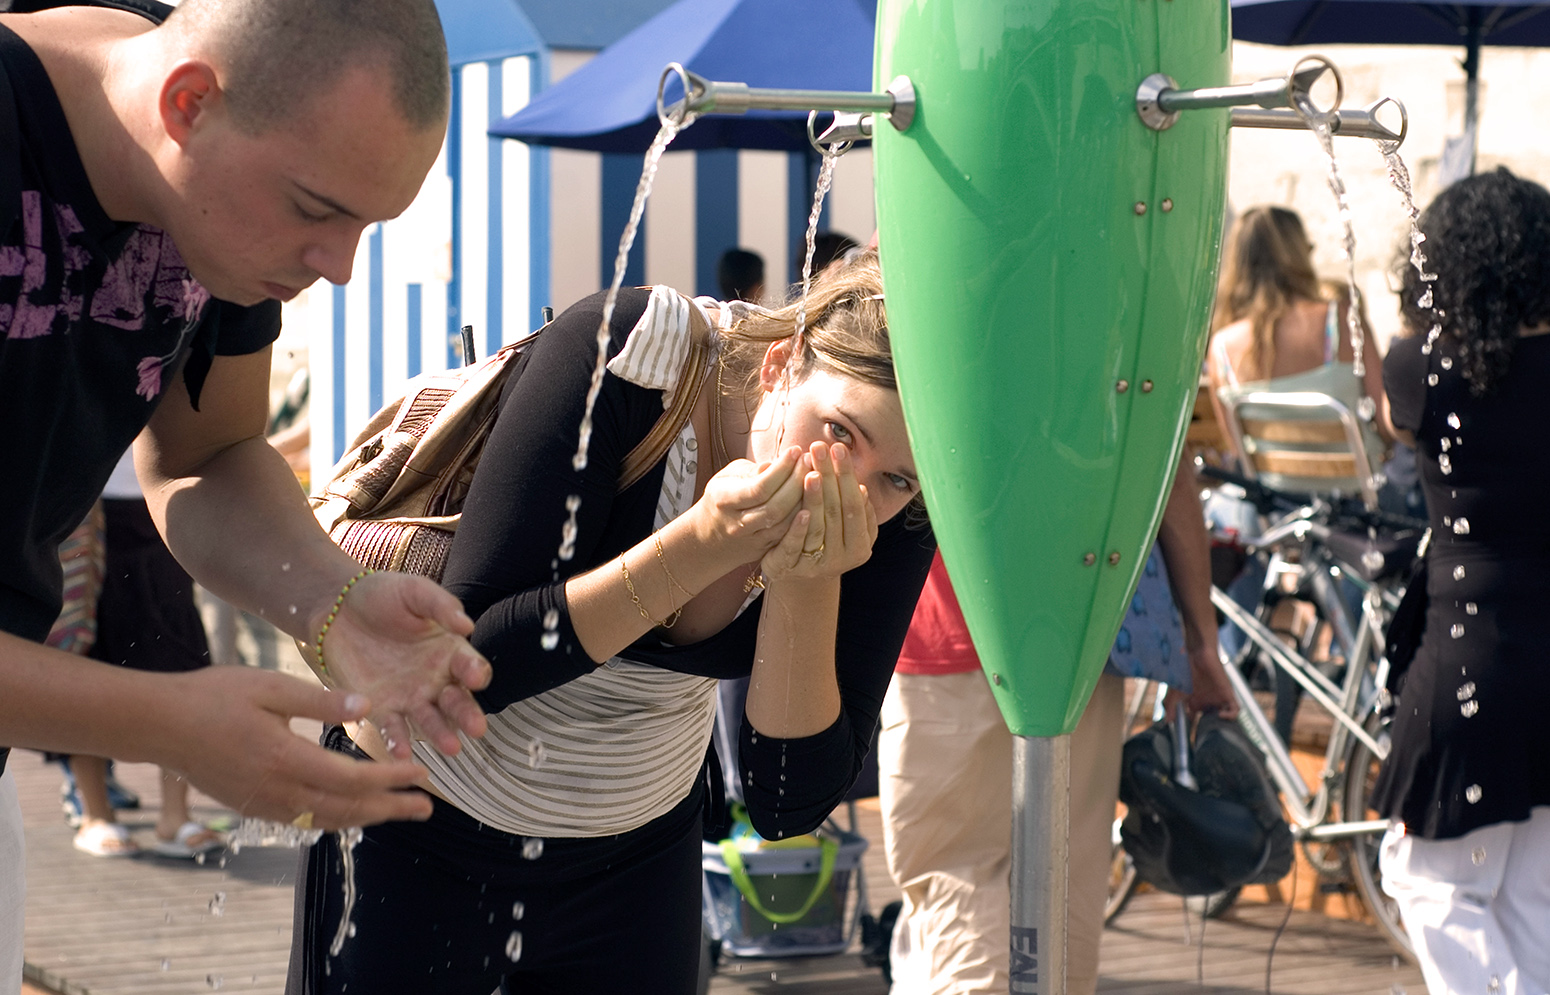
In the early 2000s, a new field of climate science research emerged that began to explore the human fingerprint on extreme weather, such as floods, heatwaves, droughts and storms.
Known as “extreme event attribution”, the field has gained momentum, not only in the science world, but also in the media and public imagination because of the power it has to link the seemingly abstract concept of climate change with our own tangible experiences of the weather.
Scientists have published more than 230 peer-reviewed studies looking at weather events around the world, from Hurricane Katrina to Russia’s 2010 heatwave. The result is mounting evidence that human activity is raising the risk of some types of extreme weather, especially those linked to heat.
Carbon Brief’s analysis suggests 68% of all extreme weather events studied to date were made more likely or more severe by human-caused climate change. Heatwaves account for 43% such events, droughts make up 17% and heavy rainfall or floods account for 16%.
To track how the evidence on this fast-moving topic is stacking up, Carbon Brief has mapped – to the best of our knowledge – every extreme event attribution study from a peer-reviewed journal.
First published in July 2017, this article is the second iteration of what will become an annual update to incorporate new studies. The aim is that it serves as a tracker for the evolving field of “extreme event attribution”.
Using the map
The map below shows 260 extreme weather events across the globe for which scientists have carried out attribution studies. The different symbols show the type of extreme weather; for example, a heatwave, flood or drought. The colors indicate whether the attribution study found a link to human-caused climate change (red), no link (blue) or was inconclusive (grey).
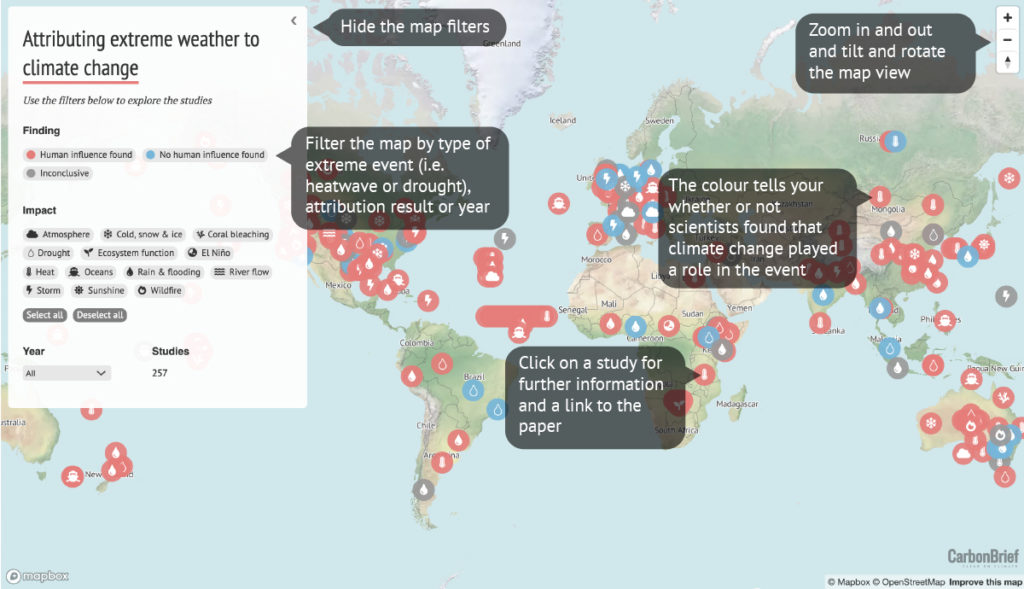
Follow this link from CarbonBrief and use the plus and minus buttons in the top-left corner, or double click anywhere, to zoom in on any part of the world. Click on a weather event to reveal more information, including a quote from the original paper to summarize the findings and a link to the online version.
The filter on the left allows users to select a specific type of weather event to look at or, for example, only those found to be influenced by climate change.
The software used to make the map currently only works with a Web Mercator projection (as used by virtually all major online map providers). It is worth noting that this – like all map projections – offers a somewhat distorted view of the world.
It is important to note that the weather events scientists have studied so far are not randomly chosen. They can be high-profile events, such as Hurricane Harvey, or simply the events that occurred nearest to scientific research centers. (More on this later.)
Weather types
The 260 weather events in the map are covered by 234 individual scientific papers. Where a single study covers multiple events or different locations, these have been separated out.
Combining the evidence over the past 20 years, the literature is heavily dominated by studies of extreme heat (31%), rainfall or flooding (20%) and drought (18%). Together, these make up more than two-thirds of all published studies (68%). The full list is available in this Google sheet.
As the chart below shows, the number of events studied each year has grown rapidly over time; from eight in 2012 to 59 in 2018. Note that the studies typically follow a year or so after the event itself as the writing and peer-review process for journal papers can take many months.
The majority of studies included here have been published in the annual “Explaining extreme events” special issues of the Bulletin of the American Meteorological Society (BAMS). Each bumper volume typically contains around 20-30 peer-reviewed studies of events from the previous year. Other studies have been found through the Climate Signals database and online searches through journals.
Extreme Weather Event Attribution Studies
Specific types of event can be displayed in the chart below by clicking on the category names at the top.
Number of attribution studies by extreme weather event type and year. Note: the total number of events dipped in 2017 because the Bulletin of the American Meteorological Society special report for that year was published in early 2018 rather than late 2017.
Most of the categories of extreme weather are self-explanatory, but “storms” and “oceans” require a bit of explanation.
For ease of presentation, the “storms” category includes both tropical cyclones (i.e. hurricanes, typhoons) and extratropical storms. The “oceans” category encompasses studies looking at sea surface temperatures and storm surges, such as those generated by Typhoon Haiyan in the Philippines and Hurricane Sandy (pdf, p17) along the eastern US seaboard.
There are also some new categories of events in this update, including “coral bleaching” and “ecosystem services”, reflecting the ongoing developments in attribution science.
For example, two studies focusing on 2016 found that El Niño and human-caused climate change combined to bring drought and poor harvests to southern Africa (pdf, p91), and that enhanced warming of sea surface temperatures increased the risk (pdf, p144) of coral bleaching on the Great Barrier Reef.
Such studies show that attribution studies are increasingly considering the impacts of extremes, rather than focusing purely on the weather event. One of the first of these “impact attribution” studies was published in 2016. It estimated that 506 of the 735 fatalities in Paris during the 2003 European heatwave were down to the fact that climate change had made the heat more intense than it would otherwise have been. The same was true for 64 of the 315 fatalities in London, the study said.
This shift towards impacts “is quite significant”, says Prof Peter Stott, who leads the climate monitoring and attribution team at the Met Office Hadley Centre and has been a co-editor of the BAMS reports since they began in 2012. He tells Carbon Brief:
“Impacts are hard to do because you have to establish a significant link between the meteorology and the impact in question. As editors, we’ve been trying to encourage more studies on impacts because it’s the impacts rather than the meteorology per se that tends to motivate these types of study – and if we only have the attribution on the meteorological event then we only have an indirect link to the relevant impact.”
Finally, some attribution research has also looked at the human influence on changes in general indicators of climate change, such as global average temperature or sea level rise. These have not been included in the attribution map as the focus here is on extremes.
Human influence
Turning to the results of the attribution studies that have been published so far, scientists found that human-caused climate change has altered the likelihood or severity of an extreme weather event in 78% of cases studied (68% made more severe or likely and 10% made less so).
In Carbon Brief’s first edition of this analysis in 2017, 68% of events were found to have a human impact (with 63% made more severe or likely and 6% less so).
Note that events are classified here as having a human impact if climate change is found to have influenced at least one aspect of that event. For example, a study of the 2011 East Africa drought found that climate change contributed to the failure of the “long rains” in early 2011, but that the lack of “short rains” in late 2010 was down to the climate phenomenon La Niña. This event is, thus, designated as having a human impact.
For the majority of events affected by climate change, the balance has shifted in the same direction. That is, rising temperatures made the event in question more severe or more likely to occur. These events are represented by the red in the chart below. Clicking on the red “slice” reveals that heatwaves account for 43% of such events, droughts for 17% and rainfall or flooding for 16%. Return to the original chart, and do the same with the other slices to see the proportion of different weather types in each category.
Summary of Human Influence in Event Attribution Studies
In 11% of extreme weather events studied, scientists found no discernible influence from human activity. These are colored blue in the map and the chart above. For a further 10% of events, the observational data or modeling techniques used in the study were insufficient to reach a reliable conclusion (shown as grey in the map and pie chart).
In 11% of studied weather events, scientists found climate change had made the event less likely or less severe (pale orange in the chart above).
Unsurprisingly, this category includes blizzards and extreme cold snaps. However, it also features a few studies that suggest climate change has lessened the chances of heavy rainfall, and another that found rising temperatures have made agricultural drought in California less likely.
Drought is complicated (more on this later). Briefly, though, it is worth noting that five other studies looking at different aspects of the California drought over 2011-17 foundclimate change had played a role. Two found no discernible link (pdf, p7-15), while one was inconclusive (pdf, p3).
As the case of California’s drought shows, it is often necessary to dig deeper to understand the full picture. The rest of this article looks at the evidence for the three most-studied types of extreme weather – heatwaves, heavy rain and floods, and droughts – as well as some of the main issues in event attribution, and where the field as a whole is heading.
Heatwaves
Of the 80 attribution studies that have looked at extreme heat around the world, 76 (95%) found that climate change had made such an event more likely or more severe. No studies found a heatwave had been made less severe by climate change, while one study (1%) identified no influence and a further three (4%) were inconclusive.
One study suggests that the Korean heatwave in the summer of 2013 had become 10 times more likely due to climate change, for example (pdf, p48). The study on extreme heat that did not find a role for climate change was an analysis of the Russian heatwave in 2010.
The most studied region for heatwaves in the literature is Australia, with around 18% of all heat-related attribution studies analysing it. All but one of the 14 studies on Australian heatwaves found climate change played a role. It is worth noting, however, that this study was inconclusive for the city of Melbourne in southeast Australia, but the authors did detect a human influence on extreme heat just up the coast in Adelaide (pdf, p145).
This raises a few important points. First, finding that climate change contributed to an event is not the same as saying it “caused” that event. Attribution is about working out if the likelihood or magnitude of a particular event happening now is different from what it would be in a world that was not warming.
A useful analogy – as explained in the first BAMS report in 2012 – is of a baseball player who starts taking steroids. If the player begins hitting 20% more home runs than before, it would not be possible to say for sure whether a particular home run is because of the steroids or the player’s spontaneous skill. But it is possible to say how the steroids have altered the likelihood that the player hits a home run, by comparing their current and historical performances. As the report put it:
“Given that steroids have resulted in a 20% increased chance that any particular swing of the player’s bat results in a home run, you would be able to make an attribution statement that, all other things being equal, steroid use had increased the probability of that particular occurrence by 20%.”
Another important point is that in cases where attribution science finds that climate change is making a given type of extreme weather more likely, it does not necessarily follow that the chance of experiencing that kind of weather gets incrementally higher each year. Natural variability means that there will still be ups and downs in the strength and frequency of extreme events.
Finally, there is usually a level of confidence attached to attribution results. So, while two studies might both find a role for human influence in a given weather event, the signal may be stronger for one than the other. For the purposes of this analysis, the attribution map does not distinguish between high- and low-confidence results, but users can click through to each study for more details.
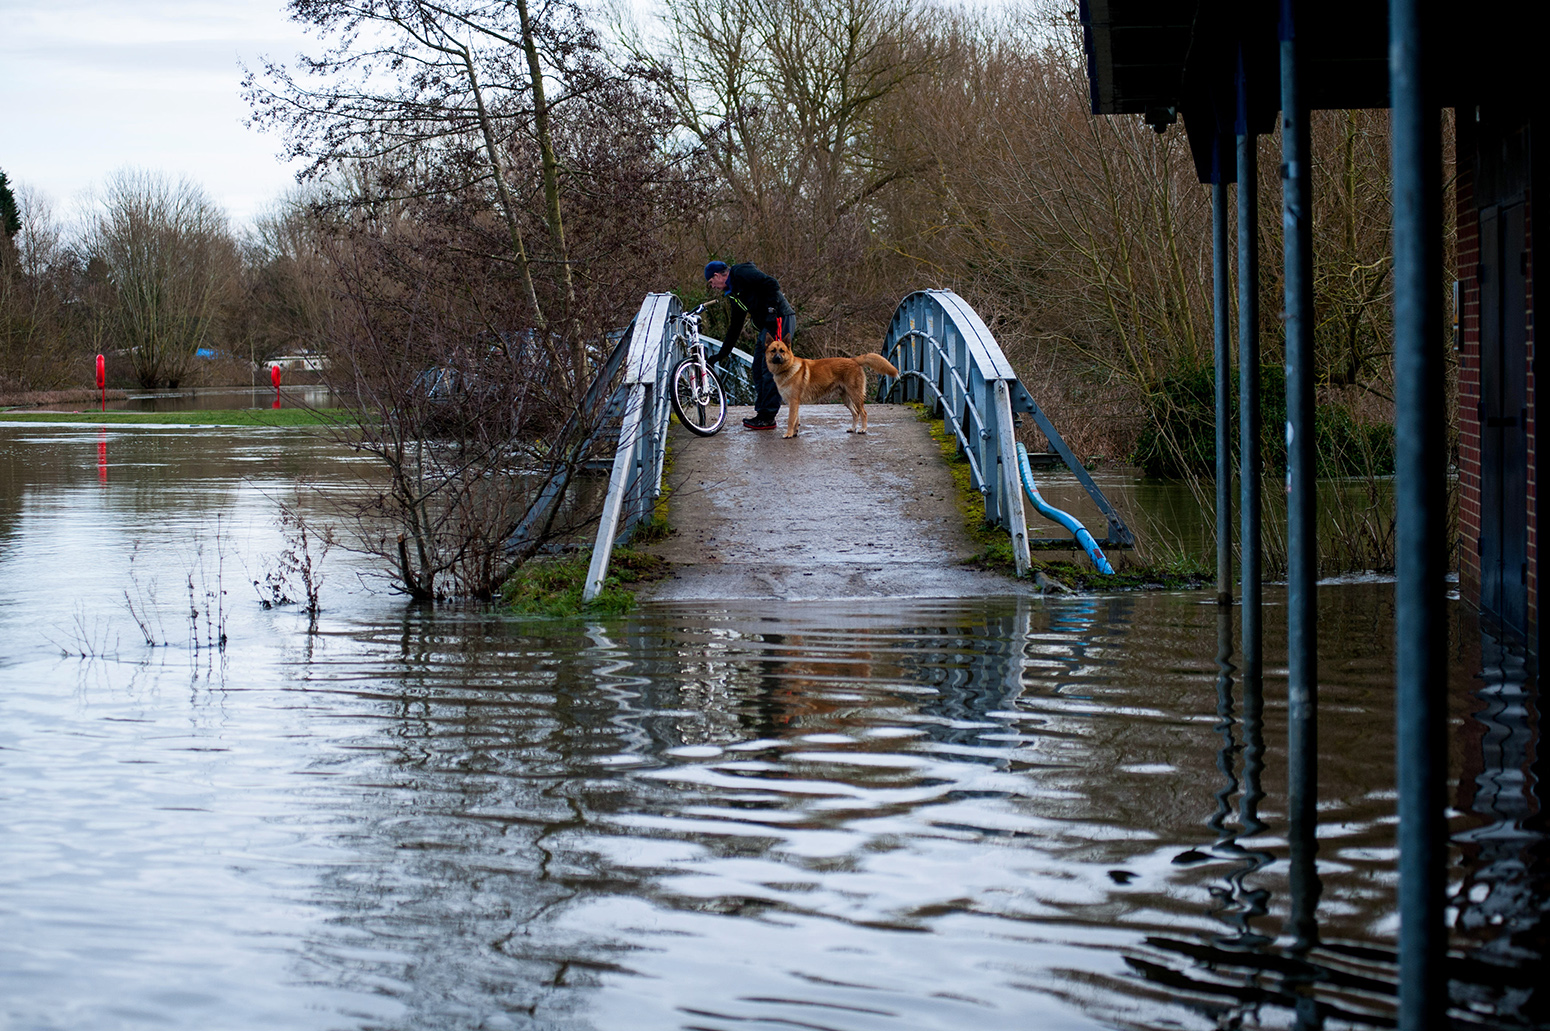
Heavy rain and flooding
Of the 51 studies to look at rainfall or flooding, 29 (57%) found human activity had made the event more likely or more severe – a far smaller proportion than for heat-related studies. Three studies (6%) found that climate change had made the whole event less likely to occur. Of the remaining studies on heavy rainfall, 13 (25%) found no evidence of a link to climate change while six (12%) were inconclusive.
That there is a more divided set of results for extreme rainfall than for heatwaves could suggest several things. In some cases, limited data might make it difficult to detect a clear “signal” of climate change above the “noise” of weather considered normal for a particular region. In other cases, an inconclusive result could reflect the fact that rainfall or flooding events are inherently more complex than heatwaves, with many ways for natural variability to play a role. Human factors, such as land use and drainage, also play a part in whether heavy rain leads to flooding.
Take the UK, for example. While one study found climate change had increased the risk of floods in England and Wales in Autumn 2000 by at least 20% (and even up to 90%), another found little influence on summer rainfall in 2012 (pdf, p36).
This raises another important point. When it comes to interpreting the results of event attribution studies, it matters what the question is. For example, a 2013 study asked whether recent wet summers in northwestern European were a response to retreating Arctic sea ice (pdf, p32). The answer from the study was “no”. But, as a foreword from that year’s BAMs report explains:
“Given the numerous ways climate change could influence precipitation in this region, a ‘no’ result for the role of Arctic sea ice should not be interpreted as an absence of any role at all for climate change.”
This is similar to an argument made by Dr Kevin Trenberth, distinguished senior scientist at the National Center for Atmospheric Research, and colleagues in a Nature Climate Change “perspective” article in 2015.
The paper notes that, in a chaotic weather system, the complex dynamics of the atmosphere mean the size and path of a storm or heavy rainfall event has a large element of chance. This can make it tricky to identify where climate change fits in, potentially underestimating its influence.
Therefore, rather than analysing the weather patterns that bring a storm to an area, the authors argue that scientists should be looking at how the impact of that storm has been boosted by temperature changes – known as “thermodynamic” effects. Higher temperatures mean warmer seas, higher sea levels and more moisture evaporating into the atmosphere. These are changes that scientists can be more confident in, the authors write, and so should be the focus for attribution studies – rather than looking at changes to circulation patterns in the atmosphere.
For example, the paper reexamines an earlier study (pdf, p15) that suggested climate change had reduced the chances of the five-day heavy rainfall event that hit north-east Colorado in September 2013. Trenberth and colleagues argue that while climate change might not have made the specific weather system that brought the rain more likely, it will have contributed to the sheer volume of moisture in the atmosphere.
Human Influence On Types of Extreme Weather
While attribution studies of heatwaves are generally more straightforward than storms – as they focus on thermodynamic influences – the type of question they are asking is still important. The Russian heatwave in 2010 is a good example of this. One studylooking at the severity of the event did not find a role for climate change. Yet another one, which did find an influence, looked at the likelihood of the event.
This apparent contradiction is tackled by a third study that reconciles other two. It explains that “the same event can be both mostly internally‐generated [i.e. by natural variability] in terms of magnitude and mostly externally‐driven [i.e. by human-caused climate change] in terms of occurrence‐probability”.
As Dr Friederike Otto, deputy director of the Environmental Change Institute at the University of Oxford and lead author of the third study, tells Carbon Brief:
“The studies, thus, only appear to be contradictory, but are in fact complementary.”
It is also important to stress that the absence of evidence for a link to climate change is not the same as evidence of absence. In other words, it does not necessarily mean there was no human influence, just that a particular analysis did not find one. This is why a single study should never be considered the final word on how climate change influences a given type of extreme weather.
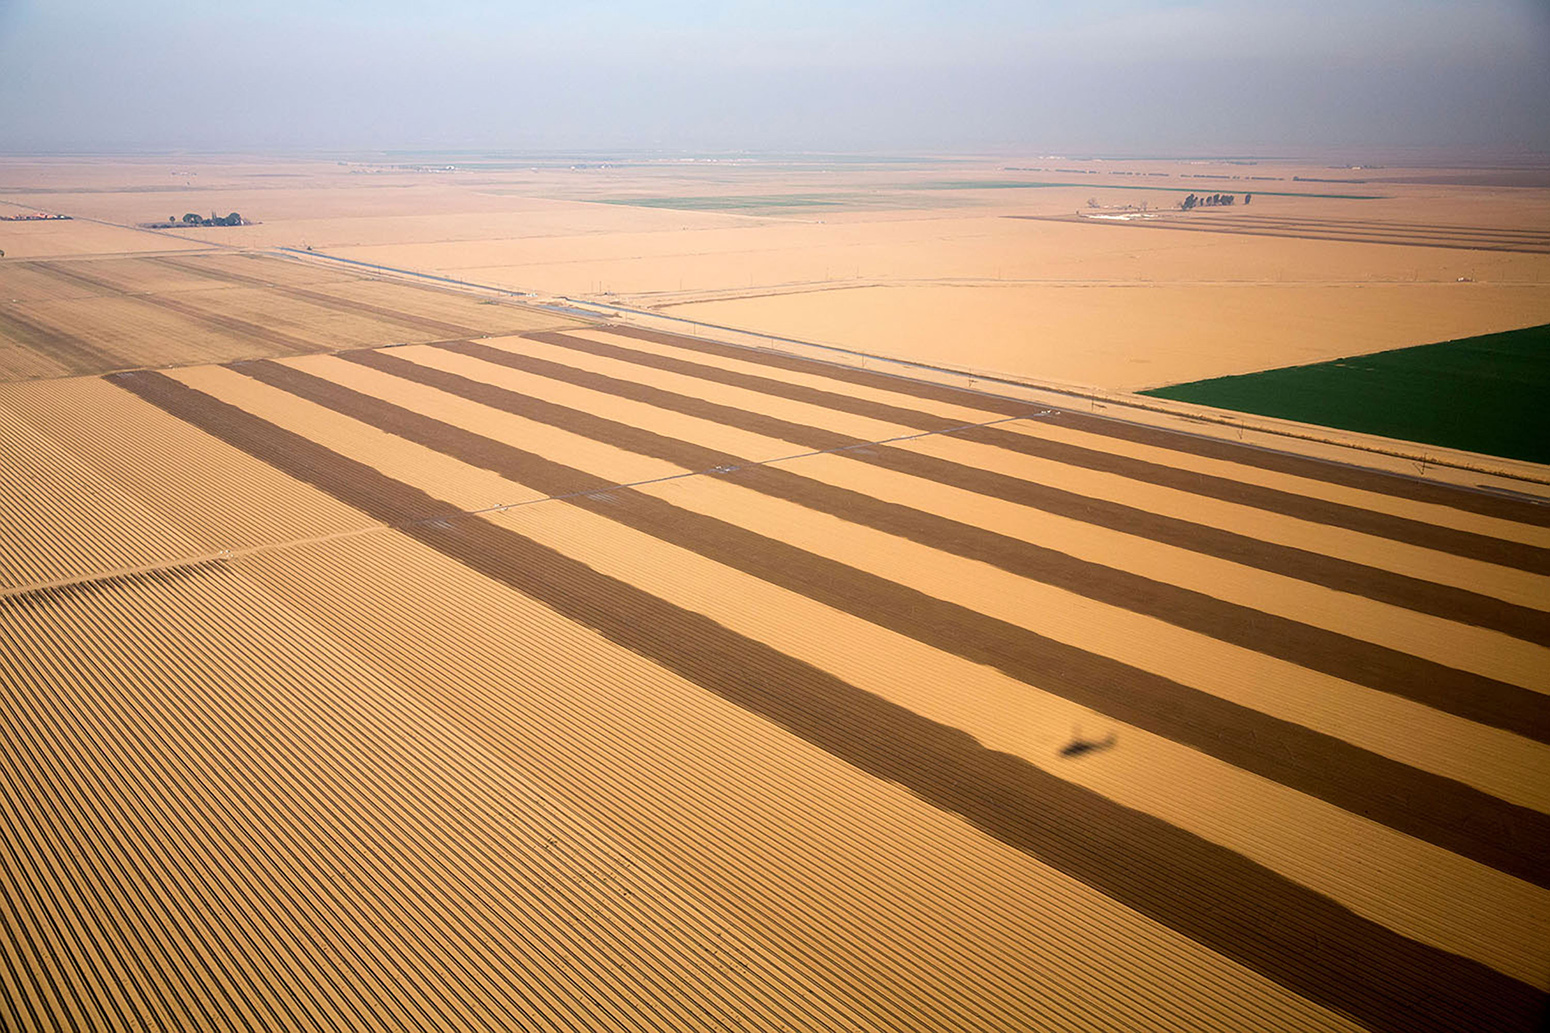
Drought
Of the 46 drought events considered in published studies, 65% found that climate change had increased the severity of the event in question, or the likelihood of it occurring. A further 20% of studies found no discernible link with human activity, while 13% were inconclusive.
This mixed bag of results reflects the inherent complexity of droughts. And, again, the specific question matters. Conclusions about the role of climate change in a specific drought could depend on whether a study looks at temperature, precipitation or soil moisture, for example.
As the 2015 BAMS report explains:
“Drought continues to be an event type where the results require significant context, and easy answers often remain elusive because of the many meteorological, hydrological, and societal drivers that combine to cause drought.”
Geographical reach
While much has been achieved in the field of extreme event attribution in a short space of time, scientists are constantly looking for ways to tailor their work to suit the people who might use it.
One major goal since the early days of the field has been to expand extreme event attribution to cover a larger and more diverse geographical area. Where in the world scientists can do attribution studies – and for what kind of events – will always be limited by the quality of the data record. But, at the moment, there is a heavy leaning towards weather events that are local to the modelling groups, or that have a particular scientific interest. Otto explains:
“For example, scientists often do attribution studies because an event occurs on their doorstep. The UK, California and Boulder [in Colorado] are, therefore, studied much more than other parts of the world, but that does not necessarily make them to places particularly impacted by climate change.”
This means that while the studies carried out so far are indicative of the role of climate change is playing in extreme weather worldwide, they shouldn’t be considered representative of all types of extreme weather everywhere, says Otto. She tells Carbon Brief:
“[The studies so far] are part of a picture, but we don’t know what’s on the missing puzzle pieces. And, crucially, we don’t know how many pieces are missing.”
Real-time
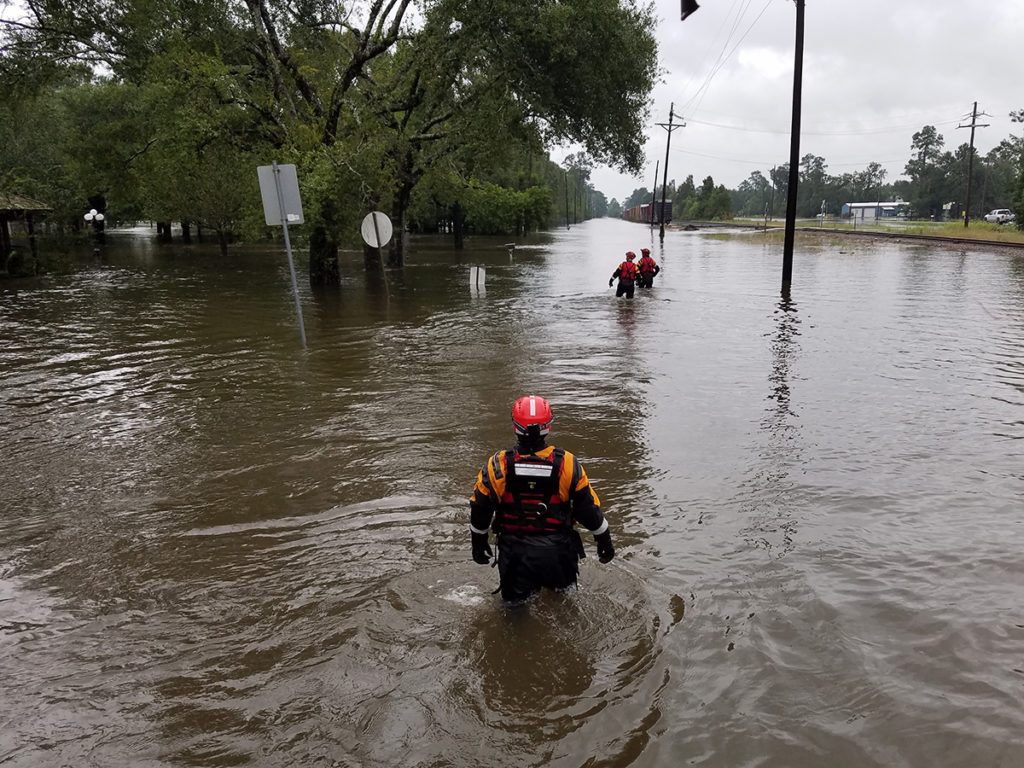
As well as expanding the science to cover different types of weather and more of the world, scientists are getting faster at turning the handle on extreme event attribution studies – sometimes crunching the numbers just days after an event has occurred. The hope within the science community is that rapid, scientifically rigorous assessments of extreme weather could be put to use in a “real-time” attribution service. As a study on flooding in Louisiana put it:
“The field of rapid attribution analysis is still nascent and may one day lead to such assessments being the normal course of action in response to an extreme event, in order to help provide scientific basis for real-time discussions and in longer-term disaster response and rebuilding.”
Much of the real-time event attribution work happening today is carried out as part of the World Weather Attribution (WWA) project – a partnership between the University of Oxford Environmental Change Institute, the Royal Netherlands Meteorological Institute (KNMI) and the Red Cross Red Crescent Climate Centre (the “Climate Centre”). A separate EU-funded project, EUCLEIA, looks specifically at climate change and extreme weather in Europe. Carbon Brief’s past articles on attribution give more information on the various methods the different groups use.
Although the specific results of “real-time” studies are not peer reviewed at the point they are made public, the methods that underpin them are. As the 2014 BAMS report explains:
“Much like other routine analysis, such as an operational seasonal forecast, statements made about heat events using these methods do not necessarily need to go through the peer-reviewed literature to be considered credible.”
That said, many real-time analyses have gone on to be published in the scientific literature a few months later. For this reason, the Carbon Brief attribution map only includes published studies and therefore may temporarily omit the most recent “real-time” studies.
Last year also saw the very first “advance forecasted” attribution analysis, which quantified the impact of climate change on the size, rainfall, and intensity of Hurricane Florence before it made landfall in North Carolina in September 2018.
The analysis ran two sets of short-term forecasts for the hurricane: one as the climate is today and the other in a simulated world without human-caused climate change. The researchers concluded:
“We find that rainfall will be significantly increased by over 50% in the heaviest precipitating parts of the storm. This increase is substantially larger than expected from thermodynamic considerations alone. We further find that the storm will remain at a high category on the Saffir-Simpson scale for a longer duration and that the storm is approximately 80km in diameter larger at landfall because of the human interference in the climate system.”
Running the attribution analysis ahead of time was “quite a cool idea”, says Peter Stott, adding that “I think we can see more of these, also potentially doing probabilistic studies based on seasonal forecasts as well as weather forecasts”. However, it is dependent on being able to forecast such events reliably, he notes.
The quality of the forecast was questionable for the Hurricane Florence attribution analysis, says Dr Kevin Trenberth, distinguished senior scientist at the National Center for Atmospheric Research, who describes it as “a bit of a disaster”. He tells Carbon Brief:
“The forecasts made were not good: the intensity of the forecast storm at landfall was category 4 or 5 as I recall, instead of category 2. And so the statements made were based on quite flawed assumptions: namely, that they had a good forecast.”
A key requirement for a reliable attribution study is for models to accurately replicate the extreme event, says Trenberth, but “obviously one can not assess the goodness of the forecast if one does this in advance”.
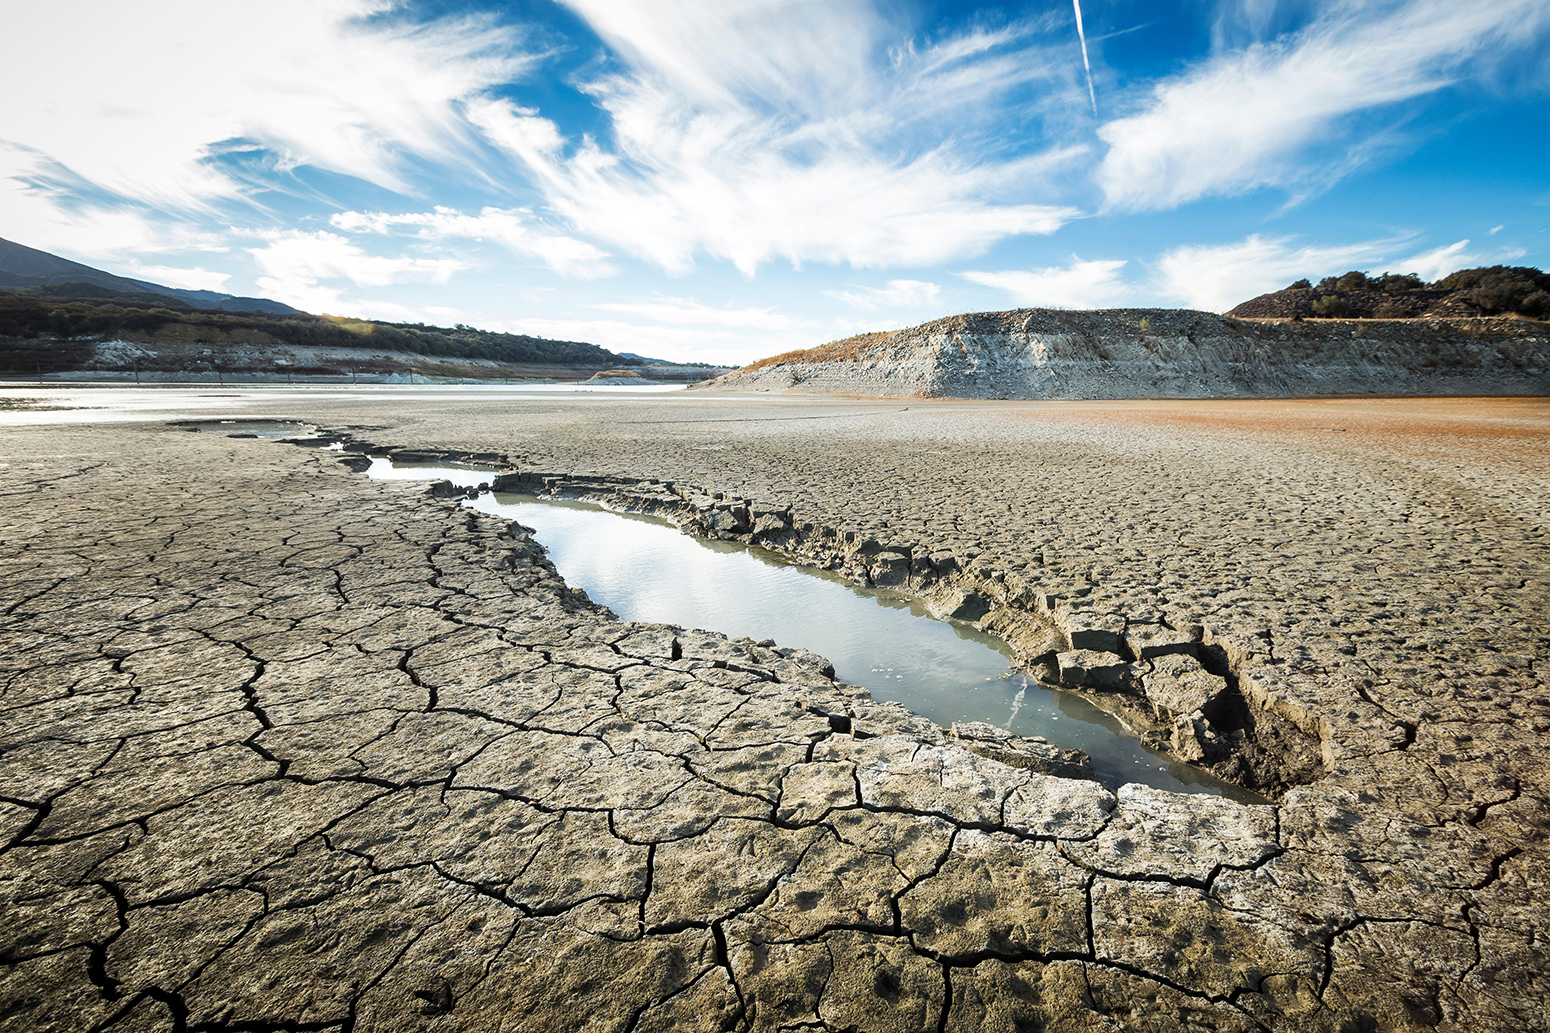
Cachuma Lake, California, USA. 2nd December, 2015. As the severe drought in California continues for a fourth straight year, water levels in the state’s lakes and reservoirs are reaching historic lows. Cachuma Lake, the primary source of drinking water for about one quarter of a million residents on the Central Coast, was at 14 percent capacity as of December 2, 2015. Water levels at the reservoir have dropped more than 80 feet since 2011, and a sizable part of the muddy lakebed is now exposed (Scott London/Alamy Live News)
An evolving science
As the science of extreme event attribution has matured and become more nuanced, so has the way we talk about extreme weather and climate change.
While some attest that all extreme weather must be affected by a world that is warming, this warrants some caution. As the first BAMS report in 2012 noted:
“While it has been argued that in the Anthropocene, all extreme weather or climate events that occur are altered by human influence on climate…this does not mean that climate change can be blamed for every extreme weather or climate event. After all, there has always been extreme weather.”
But while it would be premature to suggest that any single study is the last word, it is clear that in many cases the science can do better than that. Similarly, scientific thinking has clearly moved on from the unsatisfactory statement that it is not possible to attribute any individual weather event to climate change.
Indeed, there have been some recent studies that concluded an event – or aspect of an event – would have been “virtually impossible” or “could not have been so severe” without climate change. As one Arctic sea ice study from 2016 puts it:
“The 2012 Arctic sea ice minimum provides a counterexample to the often-quoted idea that individual extreme events cannot be attributed to human influence.”
Ultimately, there are no blanket rules in event attribution. Scientists need to examine the circumstances of each individual weather event. It is only by combining evidence from all around the world that they can begin to draw broader conclusions.
The evidence from the scientific literature – as it stands – suggests that of the extreme weather events scientists have studied so far, climate change has made more than 60% of them more likely or more damaging. The majority of these events have been heatwaves, but the fingerprint of climate change has also been felt on drought, heavy rain, wildfires and even tropical cyclones.
Carbon Brief aims to periodically add new extreme event attribution studies to our map and accompanying analysis as they are published. Please get in touch with any suggestions of attribution studies that could be included.
Categories: Climate Change